Interactive Map for NAEP
A digital experience for the National Assessment of Education Progress (NAEP)
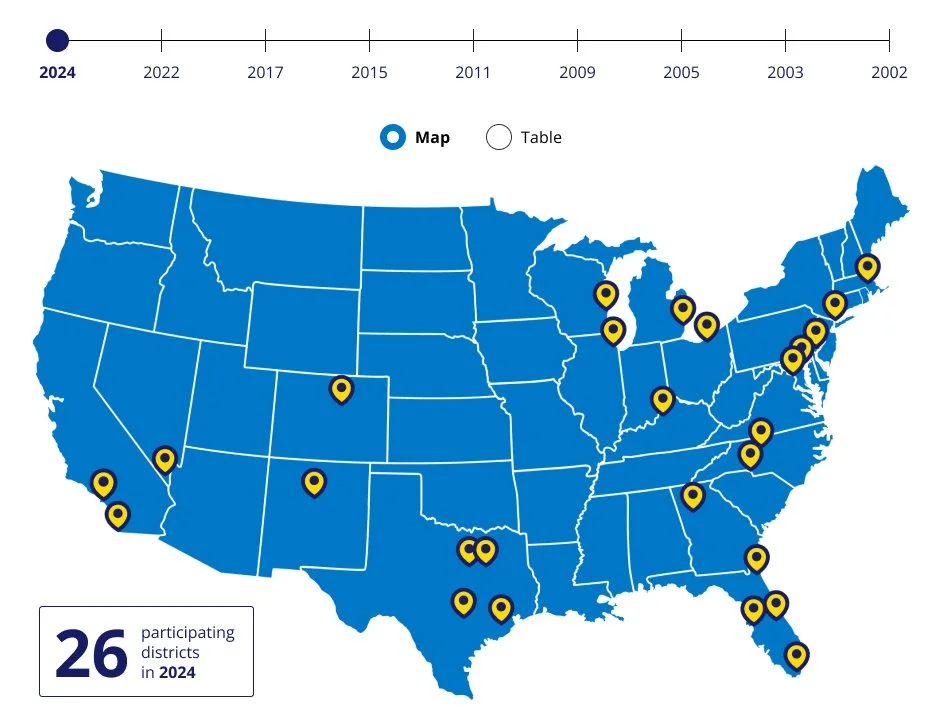
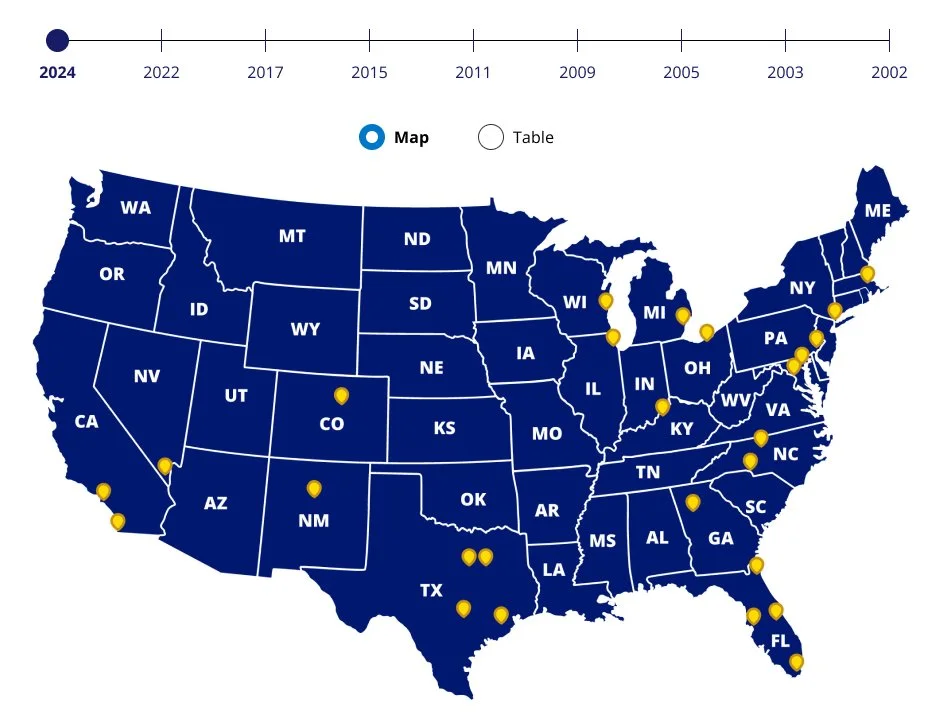
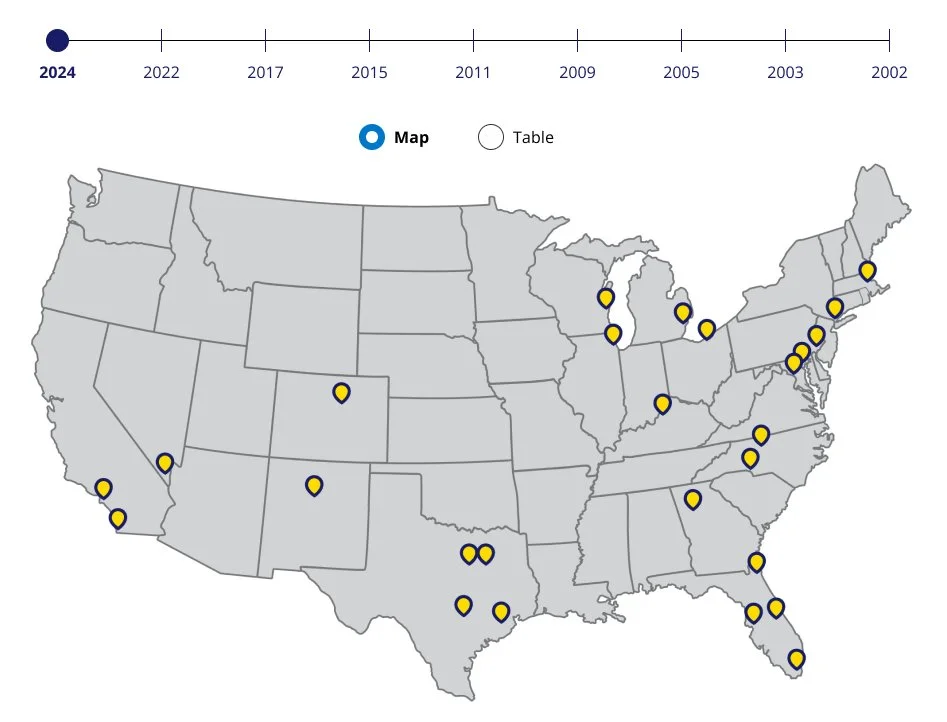
The challenge
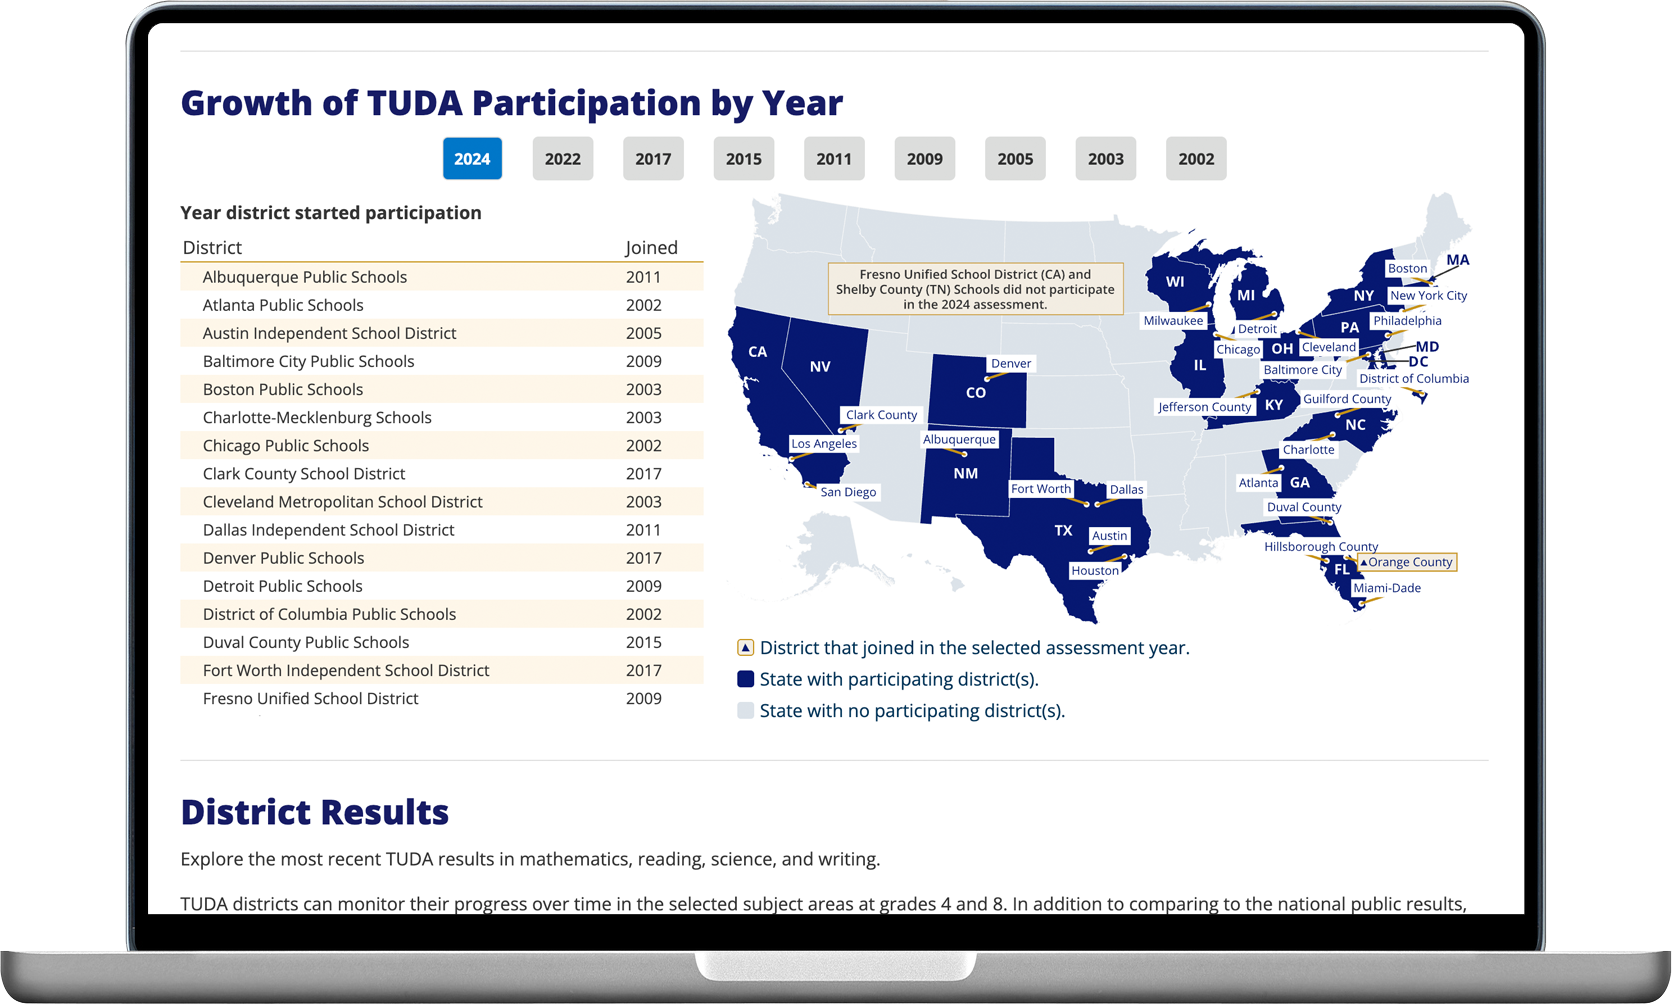
The National Assessment of Education Progress (NAEP) needed an overhaul of its Trial Urban District Assessment (TUDA) maps.
The solution
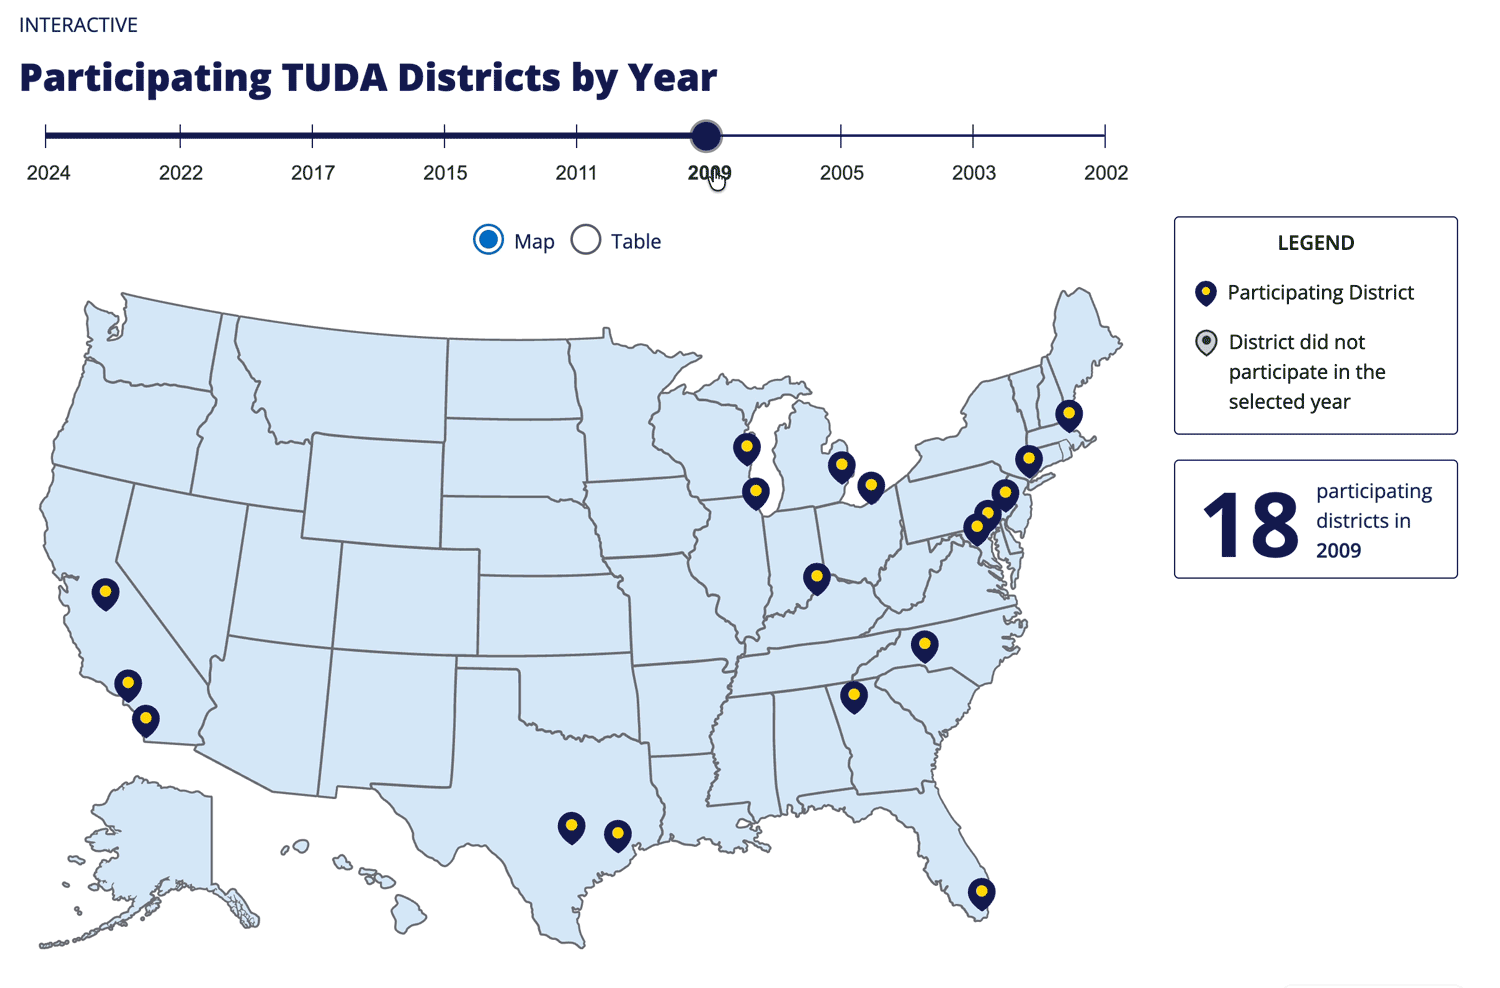
Our team identified an opportunity to transform static image content (over a dozen map images) into an interactive, engaging experience. Our transformed TUDA page tells the story of district growth over time in an immersive digital experience that is accessible and informative.
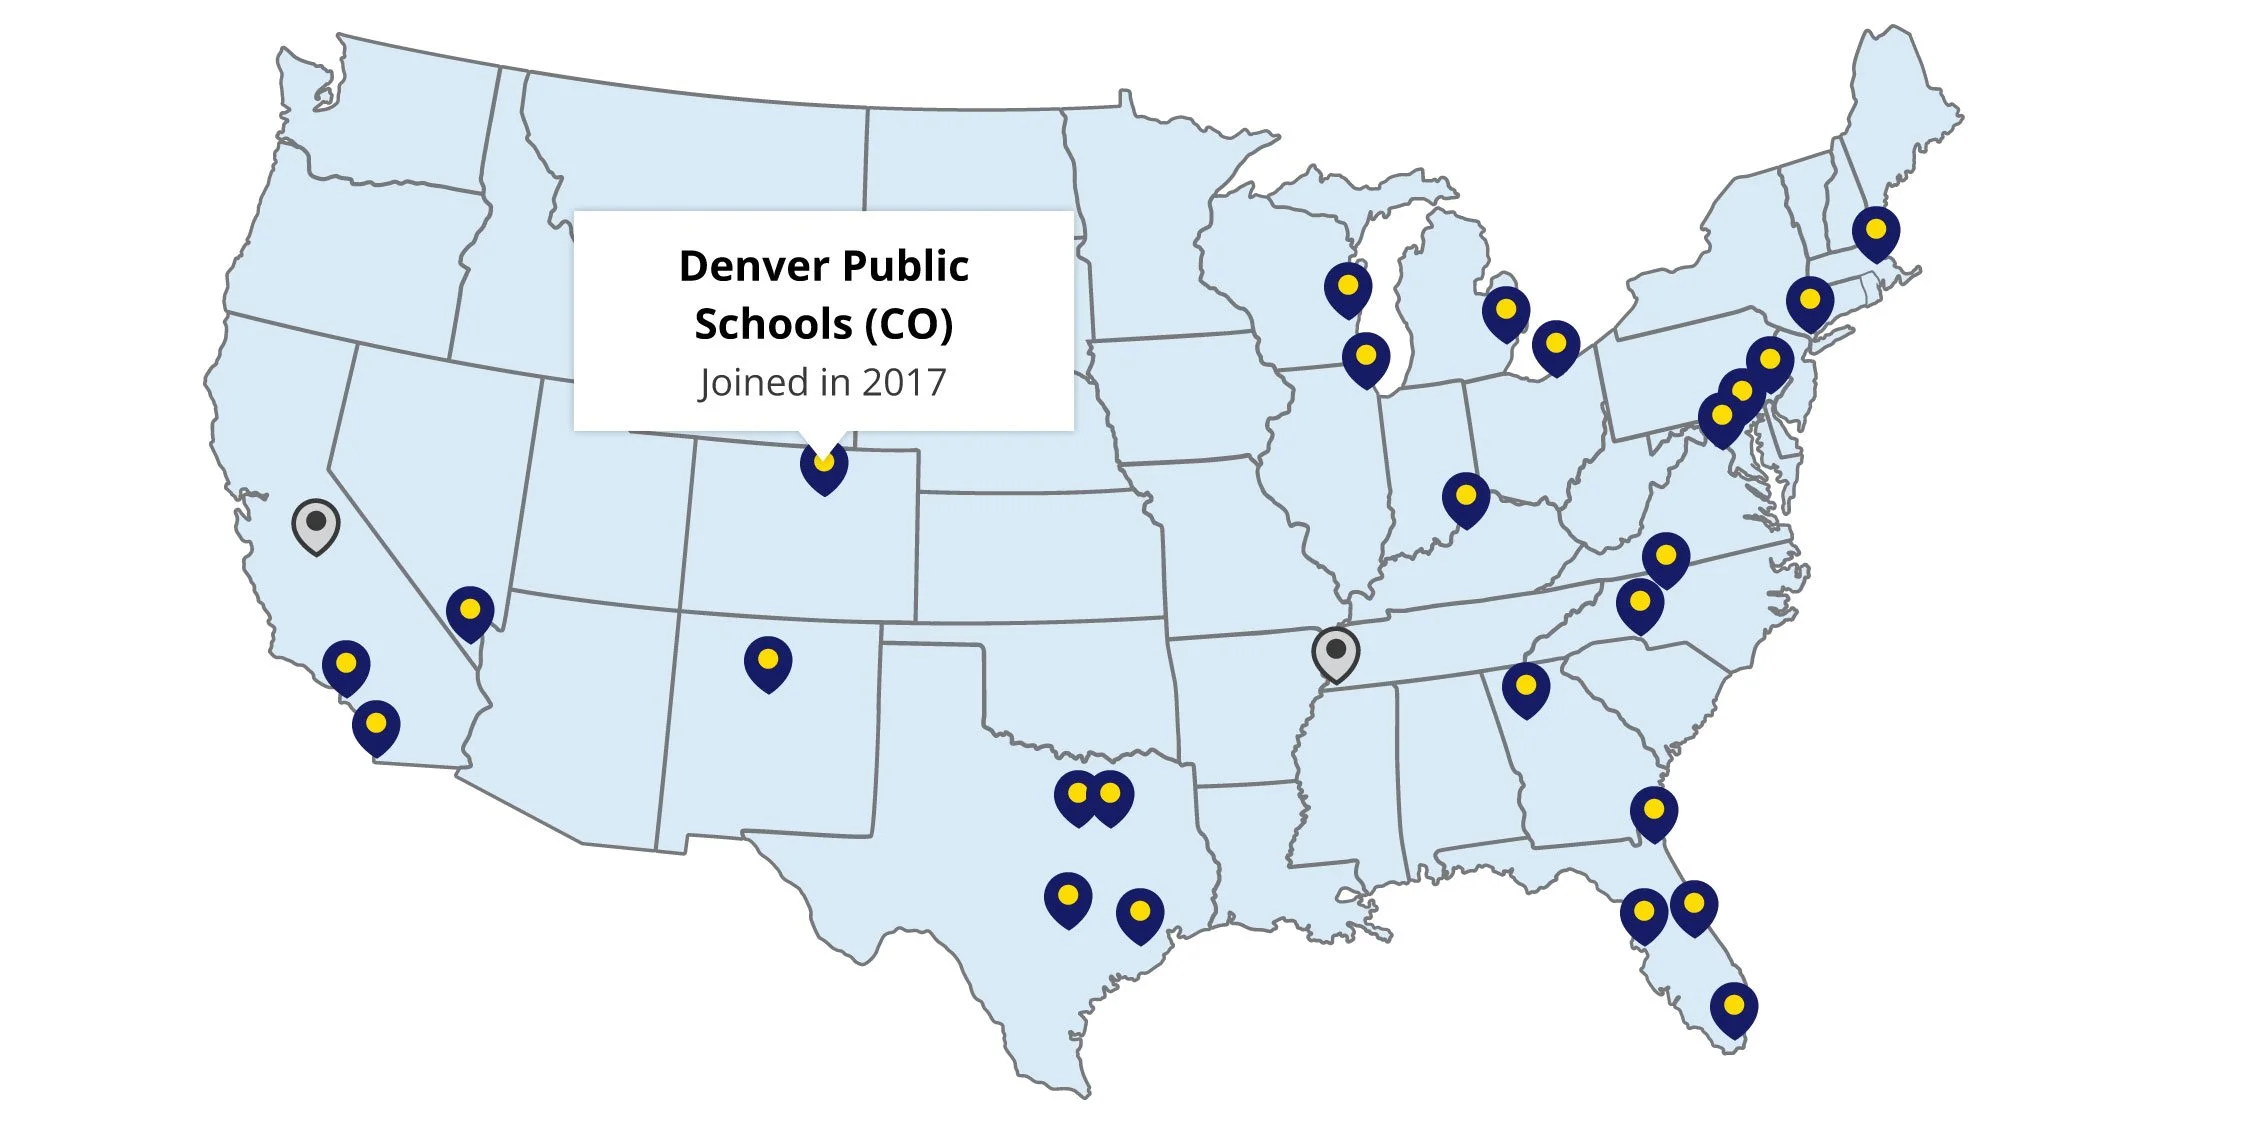
A focus on accessibility and interactivity
The previous iteration of this page (shown at right) displayed static PNG images – which had poor accessibility. We upgraded to an experience that exceeds 508 compliance and WCAG AA standards. Every element of our interactive experience can be read by screen readers or tabbed through via keyboard.
A journey of iterations
This project was designed in Figma. I collaborated with accessibility and development specialists as we reviewed color, compliance, interactions, label styles and more. See our working drafts below.